





A customer wants 150 printed hoodies for her team retreat. She fills in your quote form at 4 p.m. and waits for a price. By the next morning, she has already paid another store. Your hoodies were good, and your price may have been better. The order simply went to whoever answered first.
That story sits behind many numbers in this report. Custom printing keeps growing, and more orders start online every year. At the same time, buyers expect faster quotes, clearer prices and quicker delivery. These custom printing industry statistics show where 2027 is heading and what Shopify store owners can fix now.
Every figure links to its source so you can check it and cite it. Measured numbers come from 2025 and 2026 reports. Figures marked “projection” are our own math: the latest value grown at the rate its source reports. Treat them as planning ranges, not promises.
Custom Printing Statistics 2027 at a Glance
This table gives you the headline numbers in one place. Each measured figure links to its source. The 2027 column shows our projection or the direction the data points to.
| Metric | Latest measured data | 2027 outlook |
| Global custom printing market | $37 billion in 2026 | About $40.5 billion (projection) |
| Web-to-print market | $28.04 billion in 2026 | About $29.6 billion (projection) |
| US promotional products sales | $27.1 billion in 2025 | About $27.8 billion (projection) |
| Share of US promo sales made online | 26.3% in 2025 | About 28% (projection) |
| Print-on-demand market | $16.44 billion in 2026 | About $20.5 billion (projection) |
| Deals won by the first vendor contacted | About 80% | Quote speed matters even more |
| Free delivery window shoppers expect | 2.6 days in 2026 | Shorter than 2.6 days |
| Millennial share of print buyers | 60% in 2026 | Stays the largest group |
How Big Is the Custom Printing Market in 2027?
The global custom printing market reached $37 billion in 2026, up 9.4% from $33.84 billion in 2025. If that growth rate holds, the market lands near $40.5 billion in 2027. Another estimate puts the market at $41.34 billion in 2025, growing 8.4% a year through 2035. On that path, 2027 comes in near $48.6 billion.
Why do the two numbers differ? Each research firm draws the market boundary in a different place. Some count only personalized print, while others add apparel, packaging and gifts. For your planning, the direction matters more than the exact figure, and every major estimate shows high single-digit growth.
Here are the segment numbers worth knowing:
- The web-to-print market grows from $26.59 billion in 2025 to $28.04 billion in 2026, about 5.45% a year.
- Web-to-print software alone is worth $2.05 billion in 2026 and grows 8.1% a year.
- US custom screen printing is a $12.8 billion industry in 2026.
- Custom t-shirt printing is worth $5.1 billion in 2026, grows 9.3% a year, and screen printing holds 46% of it.
- Global commercial printing is forecast at $527.7 billion in 2027, so custom work is a fast-growing slice of a very large industry.
Which custom printing market size should you cite?
Use this table when you quote a market size in your own content or pitch deck. Match the number to what you actually sell. A custom apparel store should not quote a software-only figure.
| Market | 2026 value | 2027 projection | What it covers |
| Custom printing (global) | $37 billion | About $40.5 billion | All personalized print |
| Custom printing (alternative estimate) | About $44.8 billion (from $41.34B in 2025 at 8.4%) | About $48.6 billion | Apparel, packaging, gifts and promo items |
| Web-to-print | $28.04 billion | About $29.6 billion | Online print ordering and services |
| Web-to-print software | $2.05 billion | About $2.21 billion | Software only |
| Custom t-shirt printing | $5.1 billion | About $5.57 billion | Custom tees |
| Direct-to-garment (DTG) printing | $1.49 billion | About $1.60 billion | DTG garments |
What this means for your store: Demand is not the main risk for custom printing in 2027. The category keeps growing in every estimate. The real challenge is winning the order once a buyer arrives. The rest of this report covers that: how buyers order, ask for quotes and expect delivery.
Online Ordering Statistics: How Custom Print Buyers Shop Now
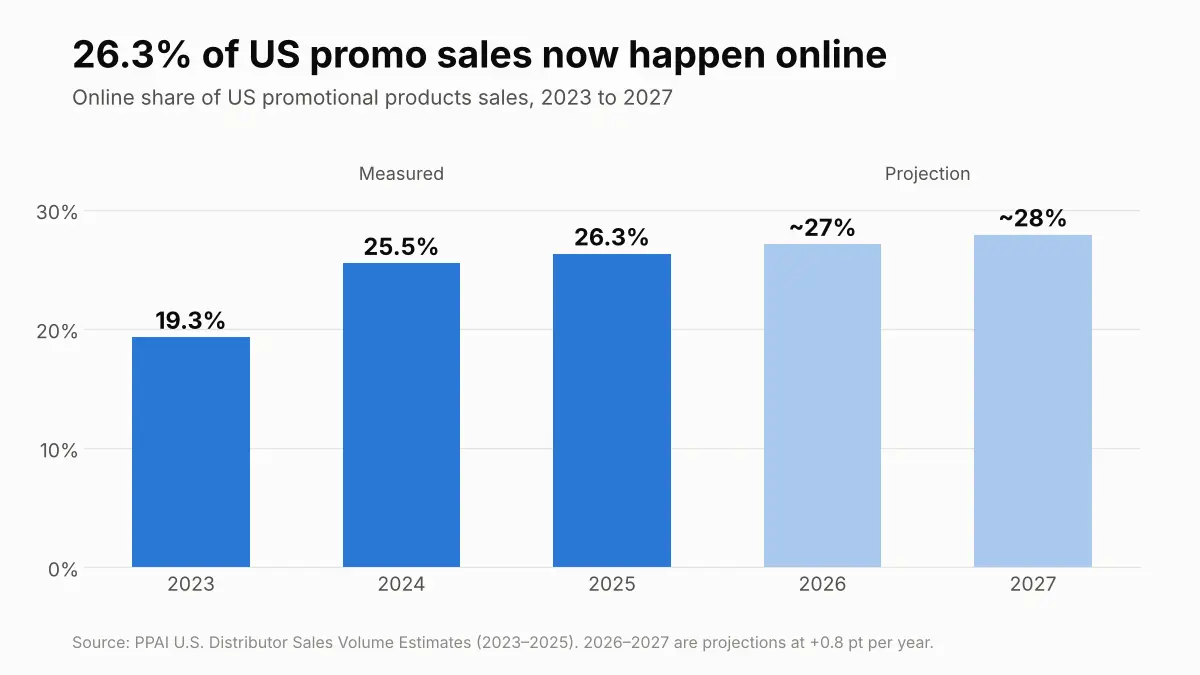
The US promotional products channel is a useful mirror for custom print. It tracks branded shirts, mugs, bags and signs, mostly ordered by businesses. In 2025, online sales reached $7.1 billion, or 26.3% of all US promo sales. Just two years earlier, online sales were $5.03 billion, only 19.3% of the total.
| Year | Online promo sales | Share of total sales | Status |
| 2027 | About $7.8 billion | About 28% | Projection |
| 2026 | About $7.4 billion | About 27% | Projection |
| 2025 | $7.1 billion | 26.3% | Measured |
| 2024 | $6.83 billion | 25.5% | Measured |
| 2023 | $5.03 billion | 19.3% | Measured |
The big jump came between 2023 and 2024, and 2025 added another 0.8 points. If that slower pace holds, about 28% of promo sales will happen online in 2027. Smaller sellers are moving fastest. Distributors under $2.5 million grew online sales 11.4% in 2025.
Desktop still closes most custom print orders
Device data adds a twist that many store owners miss. For US custom printing services, about 90% of online revenue comes from desktop and 10% from mobile. Across all online shopping, mobile drives 59% of sales. Custom orders involve artwork uploads, proofs and approvals, which people still prefer to finish at a desk.
The same data shows $2.31 billion in tracked online revenue for US custom printing services in 2025, with 10% to 20% growth forecast. So buyers discover you on a phone but often pay later on a laptop. If your store loses their cart or design between devices, you lose the sale.
What Shopify store owners can do with this:
- Make the mobile visit about browsing, pricing and saving a design.
- Keep carts and saved designs tied to the customer account across devices.
- Track conversion for custom products by device, not as one blended number.
- Send a “your design is saved” email so buyers can finish on desktop.
Order sizes are getting smaller
The largest online printer shows how order patterns are changing. VistaPrint revenue grew 6% to $1.93 billion in fiscal 2026, while business cards and stationery fell 2%. Its upload-and-print brands grew customer orders but with lower order quantities. More orders of fewer units is now normal. Your pricing and minimums should be built for that.
Bulk Quote Statistics: Why Slow Replies Lose Big Orders
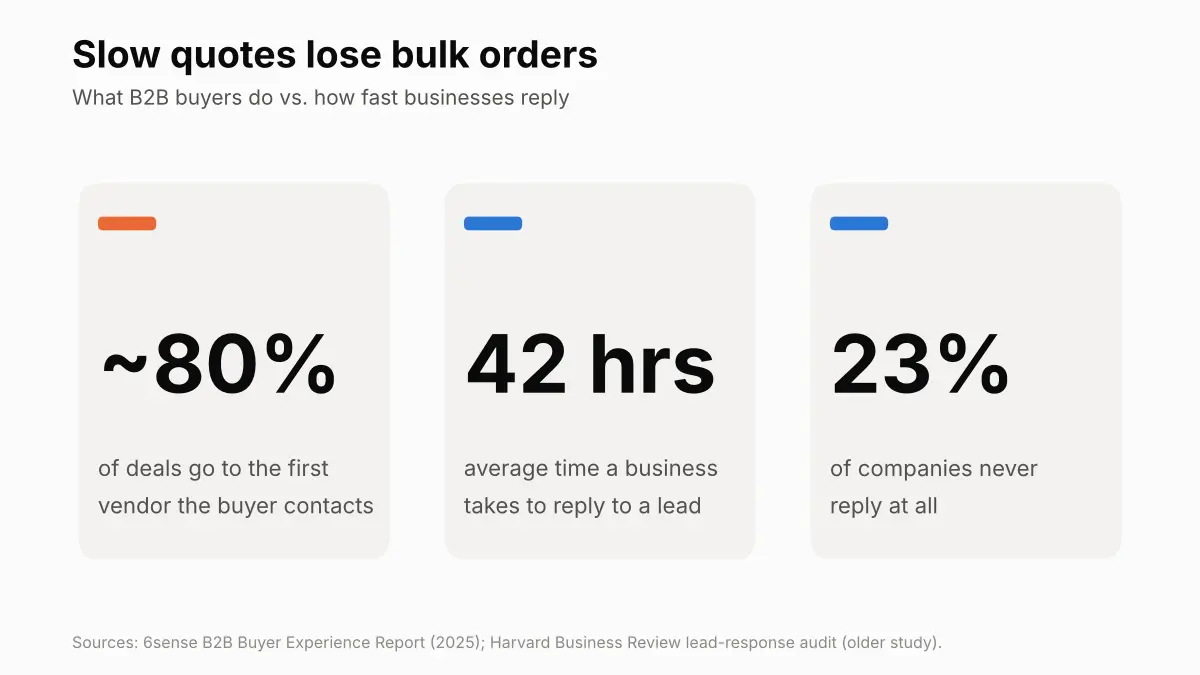
Bulk custom orders often start with a quote request, not an add-to-cart click. This is where many Shopify stores lose money without noticing it. In a survey of nearly 4,000 B2B buyers, the vendor contacted first won about 80% of the time. Buyers rarely tell you that speed was the reason they left.
Most businesses reply far slower than buyers want. An audit reported by Harvard Business Review found an average response time of 42 hours, and 23% of companies never replied. Older research found leads reached within 5 minutes were 21 times more likely to qualify than at 30 minutes. These studies are dated, but newer buyer surveys keep showing the same pattern.
Print buyers say it directly. In 2026 research, 89% of print buyers said an easy-to-work-with provider is key to choosing a vendor. The same research found buyers want an answer the moment they ask. A quote that arrives tomorrow often arrives after the decision.
Three ways to handle bulk custom orders on Shopify
This table compares common bulk-order setups by what the buyer experiences. It pulls the data above into one view. Most stores do best with a mix: instant prices for standard runs and fast quotes for unusual jobs.
| What the buyer experiences | Instant tiered price on the product page | Quote form with same-hour reply | Quote form with next-day reply |
| Time to first price | Seconds | Under 1 hour | About 24 hours or more |
| Fits these jobs | Standard items at set quantities (25, 50, 100, 250) | Mixed sizes, many colors, special finishes | Large or complex runs needing supplier checks |
| Buyer effort | Lowest: pick quantity, upload art, pay | Medium: fill a form, wait, reply | Highest: form, wait, follow up |
| Main risk | Price too low on complex jobs | Staff time during busy periods | Buyer orders elsewhere first, since about 80% of deals go to the first vendor contacted |
| What fixes it | Clear limits on what the price includes | A posted reply-time promise you can meet | An instant acknowledgment with an exact quote time |
Short runs are now a big part of bulk work
“Bulk” does not always mean thousands of units anymore. In direct-to-garment printing, print service providers hold 65.1% of the market, and online fulfillment grows fastest at 8.83% a year. That points to more small, online orders for teams, events and creators. If your minimum order is 100 pieces, you may be turning away a growing group of buyers.
What Shopify store owners can do with this:
- Show price breaks at clear quantities directly on the product page.
- Post your quote reply time beside the form, then meet it.
- Send an instant confirmation that says when the quote will arrive.
- Track how many quotes become orders, grouped by reply time.
- Review your minimum order size against the small-run demand above.
B2B Buyer Statistics: Business Customers Want to Serve Themselves
Many custom print orders come from businesses, schools, clubs and event teams. These buyers act more like shoppers than like old-style purchasing departments. 61% of B2B buyers prefer an overall rep-free buying experience. The same study found 73% actively avoid suppliers who send irrelevant outreach.
Self-service also makes business buyers happier. 95% of buyers say self-service portals improve efficiency, and two-thirds save 30 to 60 minutes per purchase. 86% of portal users rate their buying experience positively, compared with 32% of non-users. Among buyers who know portals exist, 79% actively use them.
The pain point is the reorder. A school orders 200 shirts in August and wants the same order next August. If they must email you, resend the logo and wait for a price, they may shop around. A reorder that takes two minutes keeps that account for years.
What Shopify store owners can do with this:
- Save artwork, colors and sizes to the customer account for easy reorders.
- Show order status, proof status and ship dates without needing an email.
- Accept the details businesses need, such as PO numbers and billing contacts.
- Keep outreach relevant: remind a buyer before their usual reorder season.
Who Buys Custom Print in 2027?
The print buyer has changed fast, and that shapes how your store should feel. Millennials now make up 60% of print buyers, up from 35% in 2024. These buyers grew up ordering online. They expect clear prices, quick answers and an easy process.
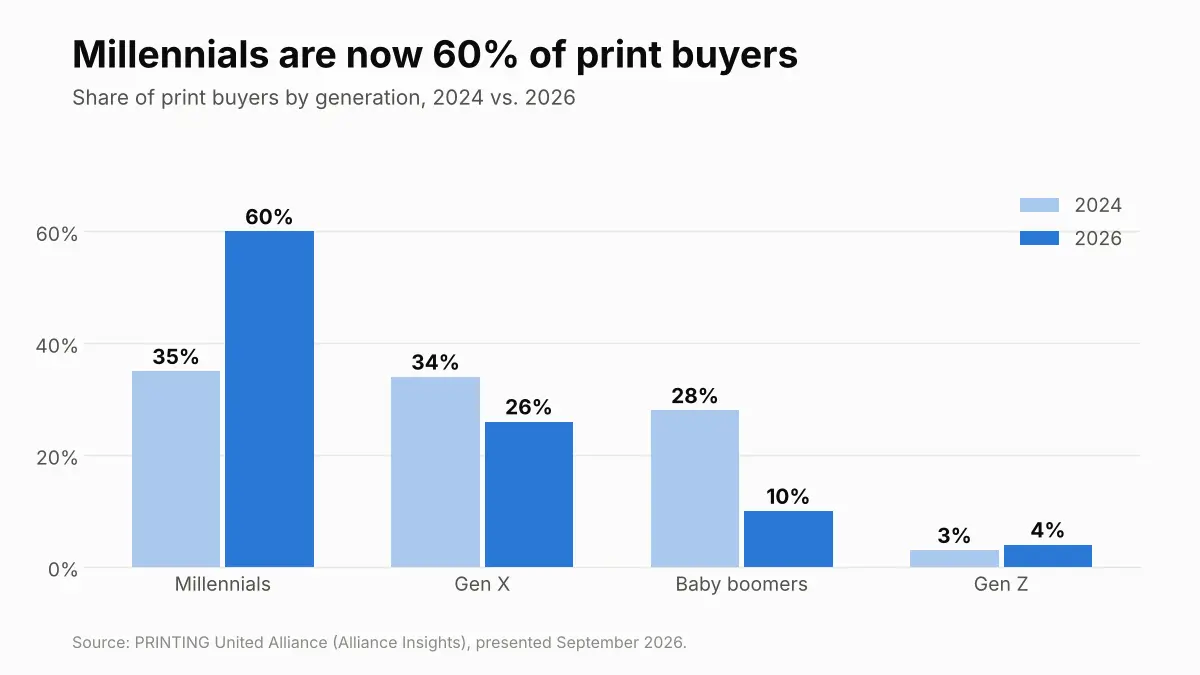
| Generation | Share of print buyers, 2024 | Share of print buyers, 2026 |
| Millennials | 35% | 60% |
| Gen X | 34% | 26% |
| Baby boomers | 28% | 10% |
| Gen Z | 3% | 4% |
Younger buyers still value printed items. 49% say print is “much better” than digital at being memorable, and 83% say it builds more trust. Price is their biggest worry. 38% say higher print service costs limit how much they buy.
What this means for your store: Your product page is your salesperson now. It should answer price, minimums, proof steps and delivery date without a call. When buyers worry about cost, show the per-unit price at each quantity. Seeing the price drop as quantity rises often turns a small order into a larger one.
Delivery and Turnaround Expectations for Custom Orders
Custom products have a built-in problem: they must be made before they ship. Shoppers do not adjust their delivery expectations for that. Consumers now expect free delivery within 2.6 days, down from about 3.5 days. 94% say free shipping affects what they buy.
Missed dates hurt more than slow ones. 52% will stop buying from a retailer after one or two botched deliveries. 90% say updated delivery dates and clear explanations are important. Honest dates, shared early, protect the relationship even when production takes time.
Retailers see the same pressure. 56.5% of customers expect delivery within 2 to 3 days, and 18.8% expect next-day delivery. For a store with a five-day production time, those numbers set a hard bar. Event buyers with fixed dates feel this the most.
Checkout is where surprises cost sales. The average online cart abandonment rate is 70.19%, and 48% of abandoners blame extra costs like shipping. 92% would abandon a cart if their preferred delivery option is missing. Custom buyers who reach checkout have already spent time on a design, so losing them there hurts twice.
What Shopify store owners can do with this:
- Show one “arrives by” date that includes production and shipping.
- Offer a paid rush option for event and deadline orders.
- Send updates at proof approval, production start and shipment.
- Show shipping costs on the product page, before checkout.
Quality, Personalization and Sustainability Expectations
Buyers judge custom products like retail products now, not like giveaways. In a study of over 5,000 US consumers, 83% said receiving a promotional product makes them feel appreciated, and 90% said it improves how they see the brand. That goodwill depends on quality. A cheap-feeling item can hurt the brand.
The same research shows what quality means to buyers. Durability (70.4%) and design (65.2%) top the list of what makes an item feel premium. Low durability (62%) and poor design (54.7%) are the top reasons items feel cheap. Business buyers are trading up too. Retail-branded promo products reached about $6 billion in 2025.
Personal and eco-friendly products keep gaining ground:
- The US personalized gifts market grows from $9.69 billion toward $14.56 billion by 2030.
- Sustainable products made up $3.8 billion, or 14%, of US promo sales in 2025.
- Shoppers will pay 9.7% more for sustainable products on average (2024 survey data).
What this means for your store: List fabric weight, print method, care steps and expected lifespan on every product. Show close-up photos of real prints, not only mockups. For eco claims, name the certification or the exact recycled percentage. Specific details build the trust that vague labels cannot.
Print-on-Demand Statistics for Shopify Stores
Print-on-demand lets you sell custom products without holding stock. The global print-on-demand market is valued at $16.44 billion and projected to reach $118.85 billion by 2035. At that growth rate of about 25% a year, 2027 lands near $20.5 billion. That is our projection, not a published figure.
Shopify sits at the center of this market. About 315,000 Shopify stores, roughly 10% of active stores, use at least one print-on-demand app. Another count finds Shopify hosts 62.8% of all print-on-demand and dropshipping stores. Growth brings crowding, so standing out takes more than a good design.
Margins and product mix show where room still exists:
- Most print-on-demand sellers target profit margins of 20% to 40%.
- Apparel holds the largest share, while home décor grows fastest at about 28% a year.
- Etsy hosts 5.7 million active sellers, up 5.9% year over year, which shows how many stores chase the same buyers.
What this means for your store: A crowded market rewards niche focus and fast, clear service. Personalization options, honest delivery dates and good product photos help you stand apart. Home décor is a category worth testing if you only sell apparel today.
Cost Pressures to Plan For in 2027
Growth in sales does not always mean growth in profit. US promo sales grew only 1.3% in 2025, slower than inflation, and many distributors “sold more but made less”. Tariffs, freight costs and tighter client budgets drove that squeeze. Looking ahead, 60% of distributors expect higher sales in 2026, but only 53% expect higher profit.
Printers feel the same caution. Half of the printers on one industry research panel canceled or delayed 2026 equipment investments. Delivery is costly too. 64% of supply chain executives say home delivery is not yet profitable.
What Shopify store owners can do with this:
- Review quantity price breaks every quarter as blank and freight costs change.
- Set a free-shipping threshold that covers your real shipping cost.
- Charge for rush production instead of absorbing the cost.
- Track profit per order, not just revenue, for custom products.
2027 Predictions: What the Custom Printing Data Points To
These predictions come straight from the trends above. Each one names the data behind it. Treat them as planning signals for your 2027 budget and roadmap.
- Online ordering passes 28% of US promo sales. The share rose from 19.3% in 2023 to 26.3% in 2025.
- Custom printing keeps growing at 8% to 9% a year. Both 9.4% and 8.4% growth estimates point to this.
- Quote speed becomes a buying criterion. With about 80% of deals going to the first vendor contacted, slow quote forms lose bulk orders.
- Delivery windows shrink below 2.6 days. The expectation already fell from about 3.5 days to 2.6 days.
- Orders get smaller and more frequent. Large online printers already report more orders with lower quantities.
- Large online printers keep growing. The biggest one guides at least 7% revenue growth for fiscal 2027, which sets a pace for buyer expectations.
How to Use These Custom Printing Statistics in Your Store
Numbers only help if they change what you do this quarter. Start with the gap that costs you the most orders. For most custom print stores, that is quote speed or delivery dates. Use this short checklist to turn the data into action.
- Time your own quotes. Send a test quote request and record the hours until the first reply.
- Add price breaks. Show per-unit prices at 25, 50, 100 and 250 units on top products.
- Show one arrival date. Combine production and shipping into a single date on the product page.
- Make reorders easy. Save artwork and sizes so repeat buyers can reorder in minutes.
- Check device conversion. Compare mobile and desktop conversion for custom products every month.
- Protect your margin. Review price breaks, shipping thresholds and rush fees each quarter.
Disclaimer
Statistics in this post come from public industry reports, surveys, company filings, and articles. Projections are our estimates, not official forecasts. Figures may vary by source, so verify original data before using them.
Conclusion
Custom printing keeps growing into 2027, with market estimates between about $40 billion and $49 billion. More orders start online, and over a quarter of US promo sales already happen there. Buyers are younger, expect instant answers and want free delivery in under three days.
The biggest risks for store owners sit at the moment of purchase, not in demand. Slow quotes lose bulk orders, unclear dates cause abandoned carts, and rising costs squeeze margins. Fix those three areas first: fast pricing, honest arrival dates and regular price reviews. These custom printing industry statistics give you the benchmarks to measure your progress through 2027.
FAQs About Custom Printing Industry Statistics
How big will the custom printing industry be in 2027?
The global custom printing market was $37 billion in 2026. At its reported 9.4% growth rate, it reaches about $40.5 billion in 2027. Other estimates place it closer to $48 billion.
What share of custom print orders are placed online?
In US promotional products, 26.3% of sales were made online in 2025. If the recent trend holds, that share reaches about 28% in 2027.
How fast should a store reply to a bulk quote request?
As fast as possible, ideally within an hour. In one large survey, the vendor contacted first won about 80% of deals. A next-day reply often arrives after the buyer has decided.
How fast do customers expect custom orders to arrive?
Shoppers now expect free delivery within 2.6 days. Custom orders need production time, so show one clear arrival date. Offer a rush option for deadline orders.
Who buys custom printing today?
Millennials make up 60% of print buyers in 2026. They expect easy online ordering, clear prices and fast answers.
Is print-on-demand still growing on Shopify?
Yes. About 315,000 Shopify stores use a print-on-demand app, and the market grows about 25% a year. More stores also means more choice for buyers, so service quality matters more.

Digital Marketing Head
Vijay Chavda is the Digital Marketing Head at SetuBridge Technolabs with 14 years of expertise in driving growth strategies. Beyond marketing, he is skilled in data analysis, leveraging Power BI and Tableau to turn insights into action, blending creativity with analytics for impactful business results.