





You opened your print-on-demand store with real excitement. Then the first month brought three orders, two refund emails, and an ad bill that ate everything. Many Shopify merchants know that sinking feeling. Now 2027 is close, and the bigger worry is falling behind again.
The data gives a clear answer. Demand for custom and personalized products keeps growing in the USA and other Tier 1 markets. AI shopping, tariffs, and faster delivery will reshape how stores win in 2027. Stores that prepare in the next few months will get a head start.
This guide shares current 2026 print-on-demand statistics and 2027 predictions, each linked to its source. It covers POD market size, personalization, profit margins, shipping, returns, AI shopping, and the Shopify app workflow. Every section ends with what to do now, so your store is ready for 2027.
2026 vs. 2027: Print-on-Demand Snapshot
The table below puts current numbers beside 2027 predictions. Rows marked with an asterisk are our projections. We calculated them by growing the source’s base figure at the source’s own stated annual growth rate.
| Metric | 2026 (current) | 2027 (prediction) | Source |
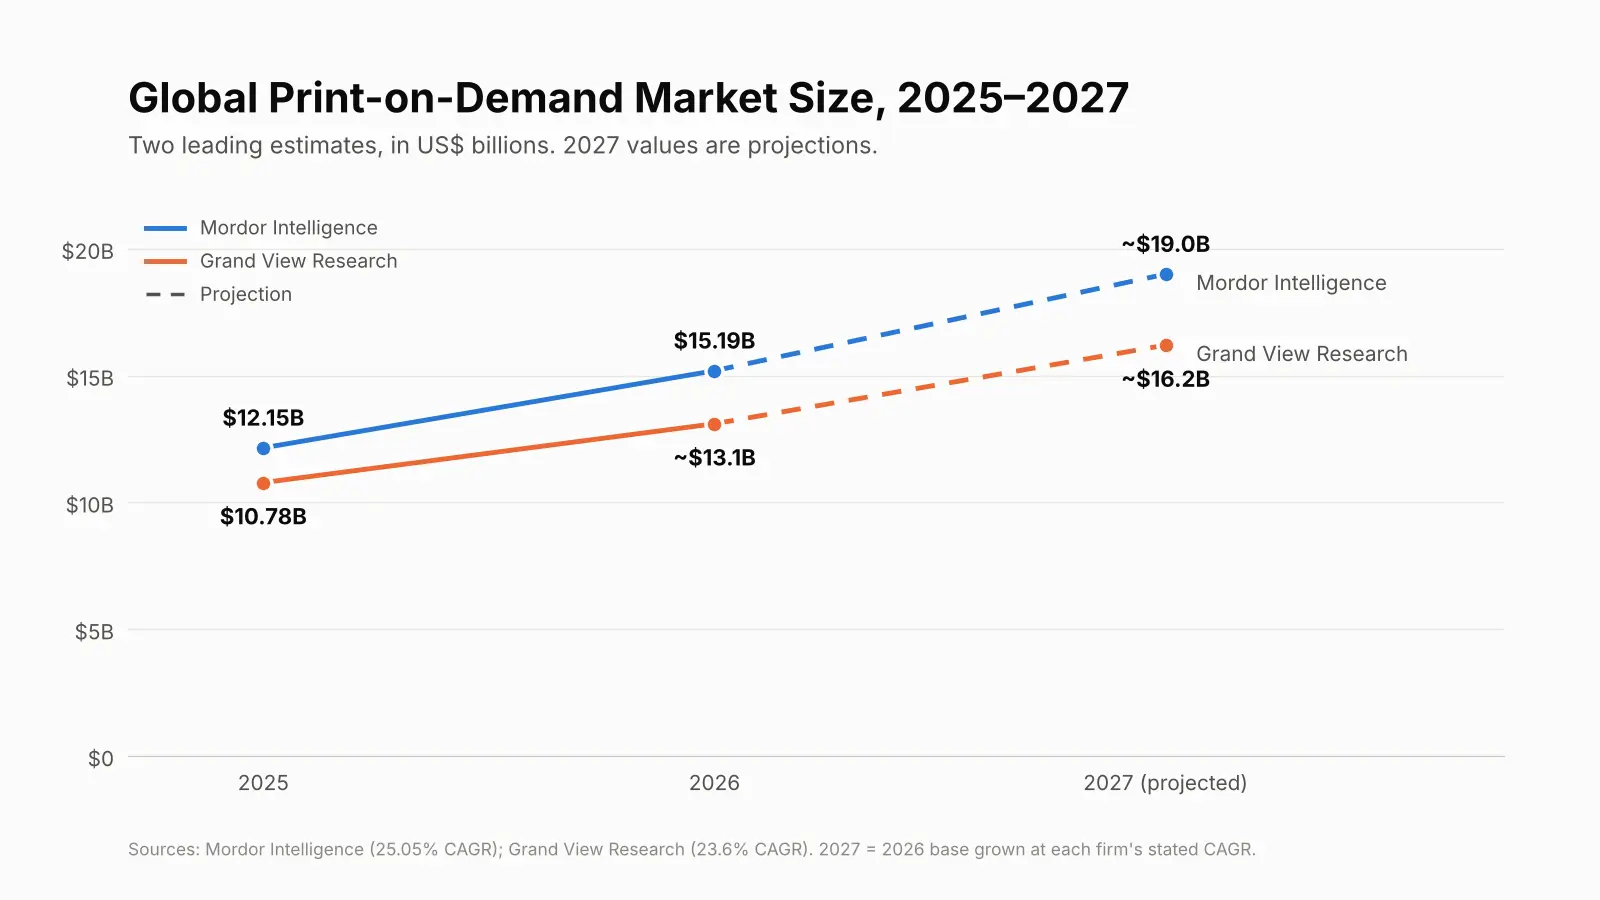
| Global POD market | $15.19B | ~$19.0B* | Mordor Intelligence (25.05% CAGR) |
| Global POD market | ~$13.1B | ~$16.2B* | Grand View Research data (23.6% CAGR) |
| Global POD market | $16.44B | ~$20.5B* | Precedence Research (24.81% CAGR) |
| US POD market | ~$3.74B* | ~$4.60B* | Grand View Research data ($3.04B in 2025, 23% CAGR) |
| US personalized gifts market | ~$11.1B* | ~$11.9B* | Arizton ($9.69B in 2024, 7.03% CAGR) |
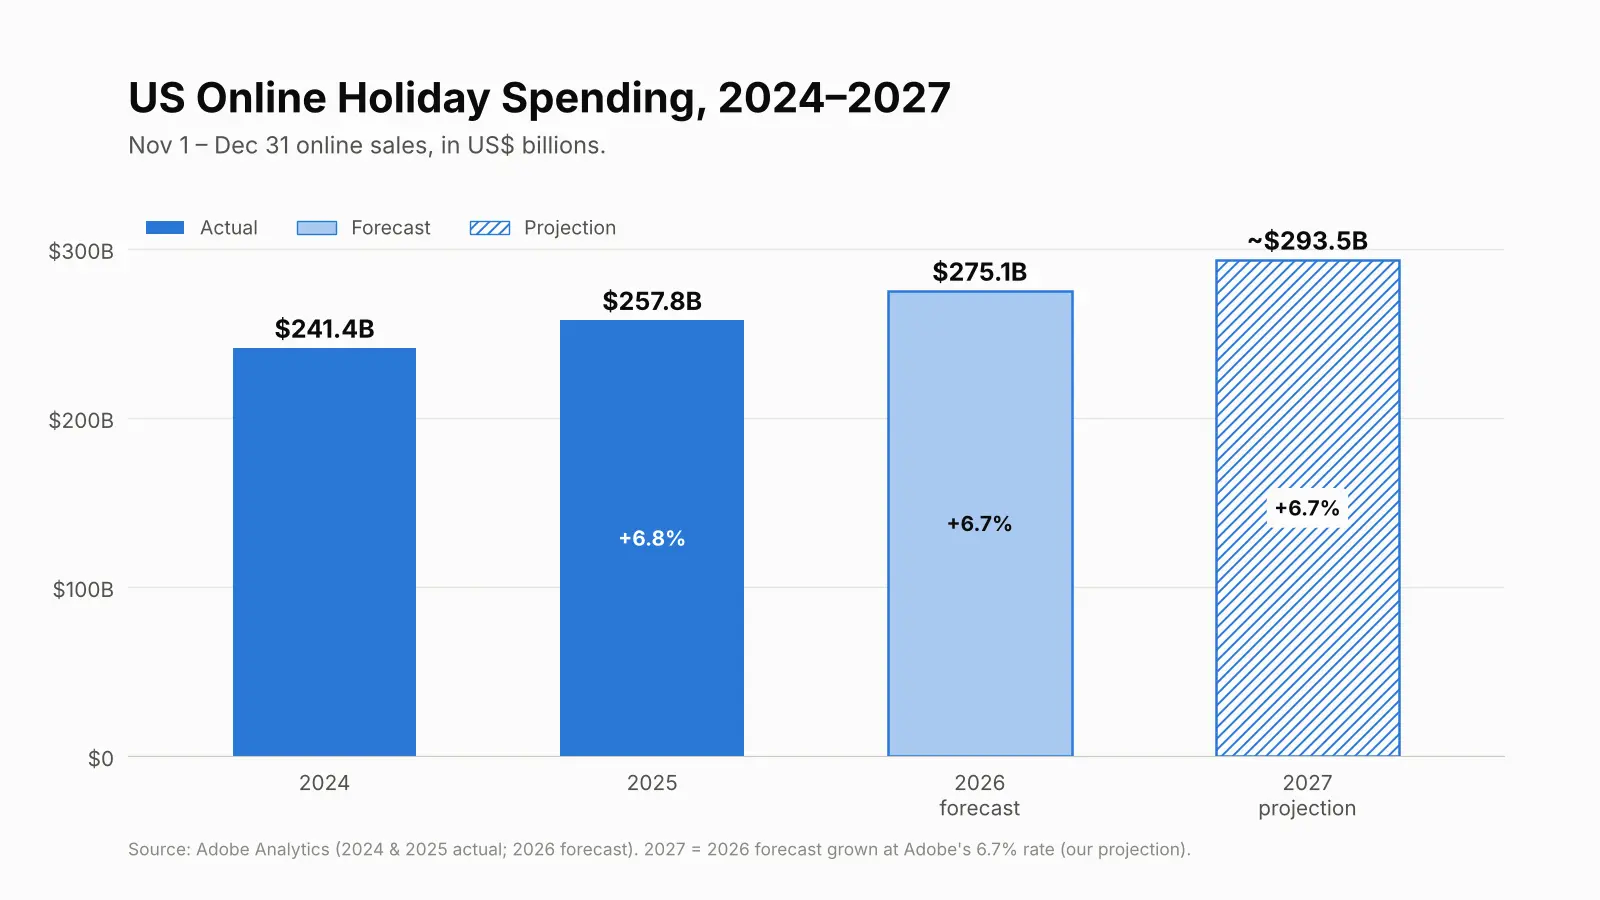
| US online holiday spending | $275.1B (forecast) | ~$293.5B* | Adobe (6.7% growth held) |
| AI shopping influence | AI traffic to retail sites up 130% | 90%+ of leaders expect AI agents to shape ≥20% of orders | Digital Commerce 360, Chain Store Age |
Print-on-Demand Market Size: 2026 Data and 2027 Predictions
There is no single “official” POD market size. Each research firm defines the market in its own way, so the numbers differ. Still, every major report expects growth of roughly 20% to 26% a year. Based on these reports, the global POD market should land between about $11.7 billion and $20.5 billion in 2027.
| Research firm | 2026 figure | 2027 projection | Long-term forecast | CAGR |
| Mordor Intelligence | $15.19B | ~$19.0B* | $46.43B by 2031 | 25.05% |
| Precedence Research | $16.44B | ~$20.5B* | $118.85B by 2035 | 24.81% |
| Grand View Research | ~$13.1B | ~$16.2B* | $57.49B by 2033 | 23.6% |
| IMARC Group | ~$13.7B* | ~$16.4B* | $61.8B by 2034 | 20.06% |
| Market.us | — | $13.79B (stated) | $43.07B by 2032 | 27.8% |
| Coherent Market Insights | $11B | ~$13.4B* | $58B by 2033 | 22% |
| The Business Research Company | $10.02B | ~$12.3B* | $23.04B by 2030 | 23.2% |
| Persistence Market Research | $9.3B | ~$11.7B* | $45.1B by 2033 | 25.3% |
*Our projection, calculated from each firm’s stated growth rate.
Current Regional and Segment Statistics
- North America held 40.15% of global POD revenue in 2025, per Mordor Intelligence.
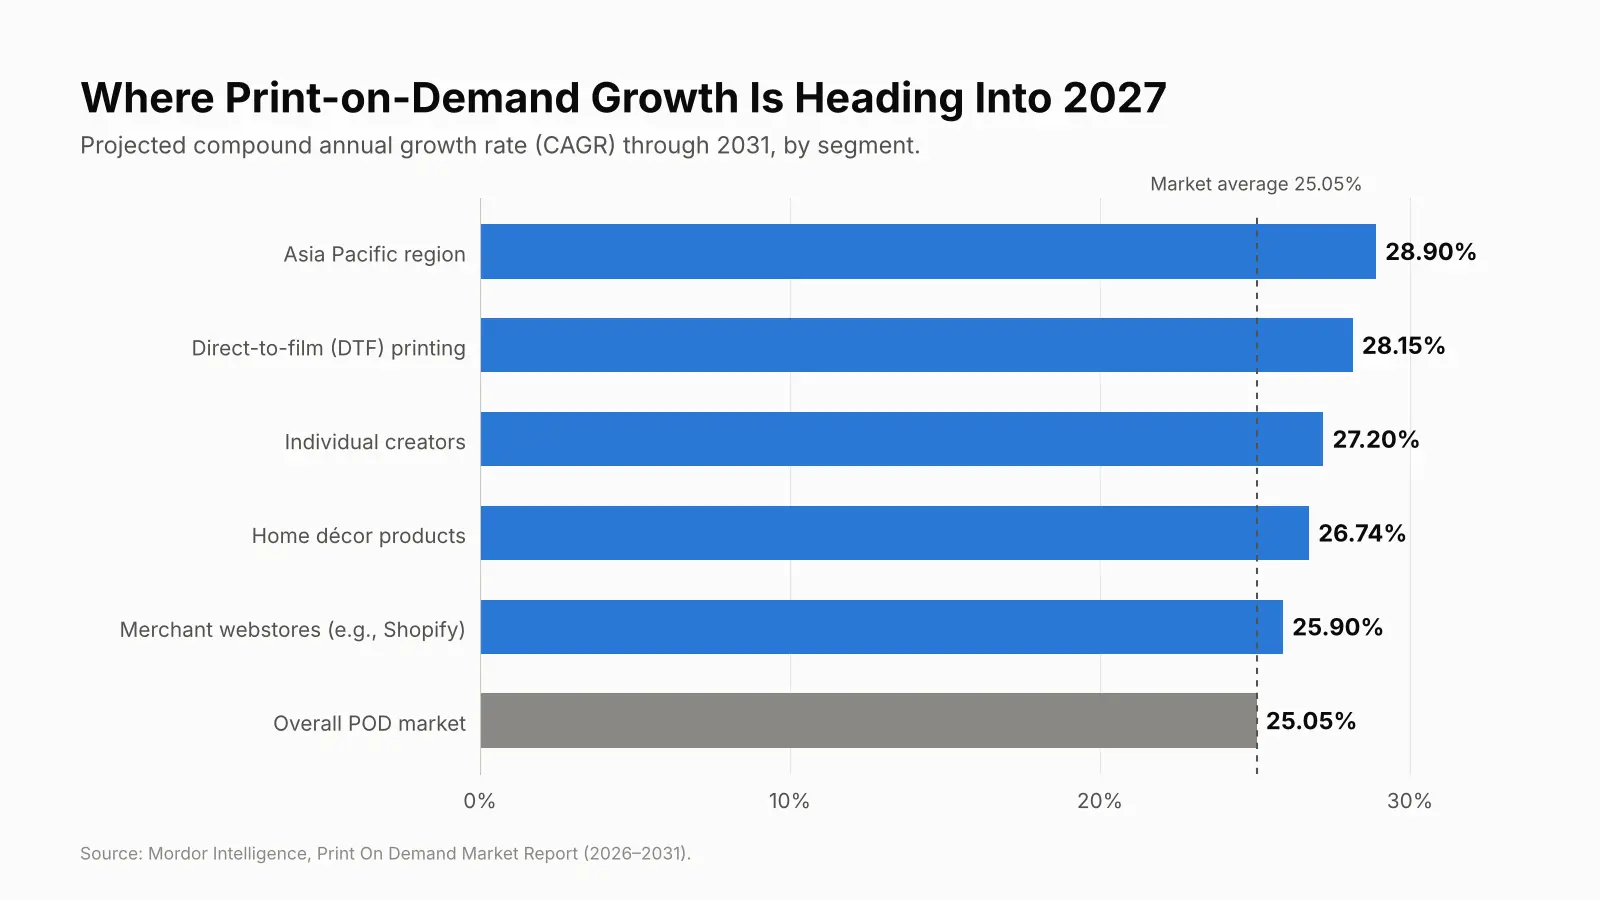
- Asia Pacific is the fastest-growing region, at 28.90% CAGR through 2031, per Mordor Intelligence.
- Apparel led the market with a 40.20% revenue share in 2025, per Mordor Intelligence.
- Home décor is the fastest-growing product type, at 26.74% CAGR, per Mordor Intelligence.
- Direct-to-film (DTF) is the fastest-growing print method, at 28.15% CAGR, per Mordor Intelligence.
- Marketplaces captured 59.72% of POD revenue in 2025, per Mordor Intelligence.
- Merchant-owned webstores, like Shopify stores, are growing at 25.90% CAGR, per Mordor Intelligence.
- More than 228,000 active stores sell POD products, with a 24% three-year survival rate, per Mordor Intelligence.
2027 Market Predictions
- Webstores should keep gaining share, since they grow faster than the overall market’s 25.05% CAGR.
- Home décor and wall art should take a larger slice of POD sales than in 2026.
- DTF-printed products should become more common, as DTF grows faster than DTG.
Get Ready for 2027
Add one décor or wall art collection beside your apparel line before Q1 2027. Build traffic to your own Shopify store, so you rely less on marketplace fees and algorithms.
Personalization Statistics and 2027 Outlook
Personalization is the strongest pricing lever a POD store has. By 2027, shoppers will expect this option as a standard feature, not a bonus.
Current Personalization Statistics
- 71% of consumers expect personalized interactions from brands, per McKinsey.
- 76% get frustrated when personalization does not happen, per McKinsey.
- 78% say personalized content makes them more likely to repurchase, per McKinsey.
- Consumers will pay 25.3% more, on average, for personalization, per Dassault Systèmes.
- Only 21% will wait four or more days for a personalized product, per Dassault Systèmes.
- 1 in 5 interested consumers will pay a 20% premium for personalized products, per Deloitte.
- The US personalized gifts market may reach $14.56 billion by 2030, per Arizton.
2027 Personalization Predictions
- The US personalized gifts market should reach about $11.9 billion in 2027, based on Arizton’s 7.03% CAGR.
- Global personalized gift sales should reach about $44.6 billion in 2027, based on Research and Markets’ 5.7% CAGR from $37.8 billion in 2024.
- Demand for personalized fashion and gifts adds about 3.8 points to POD growth over the long term, per Mordor Intelligence.
Get Ready for 2027
Many shoppers want personalized items, yet few have bought one. That gap usually comes from slow, confusing ordering. Add a live preview, a short form, and a clear delivery date to your top three products. Price them 15% to 25% above the plain version, then test before the 2027 gifting calendar starts.
POD Profit Margin Statistics and 2027 Cost Outlook
Margin is where most POD stores win or lose. Base cost, shipping, fees, ads, and reprints come out of every order. In 2027, duties and price pressure will squeeze plain products further. Personalized and premium items will carry most of the profit.
Current Margin and Cost Statistics
- Most POD sellers target profit margins between 20% and 40%, per Printful.
- Basic items can drop to 10%, while personalized products can pass 50%, per Printful.
- Heavy discounting pulls average POD seller margins close to 20%, per Mordor Intelligence.
- Platform fees can absorb up to one-quarter of gross revenue, per Mordor Intelligence.
- Paid plans on Printful, Printify, and Gelato each offer up to 33% off products.
2027 Margin Predictions
- Price pressure is expected to trim about 2.8 points from POD growth in the short term, per Mordor Intelligence.
- Cheaper DTG and DTF equipment should add about 3.5 points through lower unit costs, per Mordor Intelligence.
- Generative AI design tools should add about 2.9 points by cutting artwork cost and time, per Mordor Intelligence.
Example: How Personalization Changes One Order’s Margin
The table uses simple assumptions, not survey data. Swap in your own costs.
| Line item (assumed) | Plain tee at $26.00 | Personalized tee at $32.00 |
| Product base cost | $12.50 | $12.50 |
| Shipping you absorb | $4.75 | $4.75 |
| Payment fee (3% + $0.30) | $1.08 | $1.26 |
| Personalization app fee | $0.00 | $0.50 |
| Ad cost per order | $7.00 | $7.00 |
| Returns and reprint reserve (5%) | $1.30 | $1.60 |
| Profit per order | -$0.63 | $4.39 |
| Net margin | -2.4% | 13.7% |
The plain tee loses money once ads and reserves are counted. The personalized version earns $4.39 because the price rises $6 while costs rise only $0.98.
Get Ready for 2027
Run this table for your top five products before January. Remove any product that cannot clear 15% after ads. Move budget toward personalized and décor items, where shoppers accept higher prices.
Shipping, Returns, and Duty Statistics for 2026–2027
Shipping cost and delivery time decide many POD sales at checkout. Returns and reprints then decide how much of that sale you keep. In 2027, duty rules will make production location a margin decision too.
Current Checkout and Delivery Statistics
- The average online cart abandonment rate is 70.22%, per Baymard Institute data.
- 39% of shoppers abandon because extra costs like shipping are too high, per Baymard Institute data.
- 21% abandon because delivery is too slow, per ReadyCloud.
- Gelato produces 85% of orders within the destination region, per Mordor Intelligence.
- Printify Express Delivery reaches mainland US buyers in 2–3 business days, production included, per Printify.
Current Returns Statistics
- 19.3% of US online sales were expected to be returned in 2025, per the National Retail Federation.
- Total US returns reached $849.9 billion, or 15.8% of sales, per the National Retail Federation.
- Online apparel has a 24.4% US return rate, per Size.ly citing Coresight Research.
Duty Changes Heading Into 2027
- The US ended the $800 de minimis exemption for all countries on August 29, 2025, per Logistics Manager.
- A permanent US repeal of the exemption takes effect on July 1, 2027, per Easyship.
- The EU began phasing out its own low-value duty exemption on July 1, 2026, per The Sales Tax People.
- Customs delays on small cross-border parcels may trim about 1.9 points from POD growth, per Mordor Intelligence.
Get Ready for 2027
Show shipping cost and a delivery date on every product page, not only at checkout. Route US orders to US production, since small imports no longer enter duty-free. Add size charts with real garment measurements to cut apparel returns before the 2027 season.
Sales Channel, Holiday, and AI Shopping Statistics
Current Shopify and Marketplace Statistics
- Shopify GMV reached $115.6 billion in Q2 2026, up 32% year over year, per Shopify’s SEC filing.
- About 315,000 Shopify stores use a POD app, out of roughly three million active stores, per Store Leads.
- Etsy marketplace GMS rose 7.5% to $2.6 billion in Q2 2026, per MarketBeat.
2026 Holiday Season Forecast
- US online holiday spending is forecast at $275.1 billion, up 6.7%, per Adobe.
- Cyber Week is expected to drive $47.5 billion, up 7.4%, per Adobe.
- Online apparel holiday sales are forecast at $51.3 billion, up 4.7%, per Digital Commerce 360.
- Mobile should drive 57.4% of holiday spend, up from 56.4% in 2025, per Digital Commerce 360.
- Buy now, pay later should drive $21.3 billion, up 6.6%, per Adobe.
AI Shopping and 2027 Predictions
- AI traffic to US retail sites is forecast to rise 130% this holiday season, per Digital Commerce 360.
- AI and agents influenced about 20% of global 2025 holiday sales, or $262 billion, per State of AI citing Salesforce.
- More than 90% of ecommerce leaders expect AI agents to influence at least 20% of orders by 2027, per Chain Store Age.
- More than one in three leaders believe AI agents could shape over half of transactions by 2027, per Chain Store Age.
- US retail ecommerce is forecast to reach $1.72 trillion by 2027, over 20% of retail sales, per eMarketer.
- US marketplace ecommerce sales should reach $603.2 billion in 2027, per eMarketer.
- If 2026 holiday growth holds, US online holiday spend would reach about $293.5 billion in 2027 (our projection from Adobe’s 6.7% rate).
Current POD Seller Growth Statistics
- POD sellers take 165 days, on average, to reach their first $1,000 in revenue, per Printify.
- Successful sellers reach $1,000 in under 118 days after about 67 new listings, per Printify.
Get Ready for 2027
AI agents read product data, not just images. Write clear titles, full descriptions, sizes, materials, and delivery times for every listing. Launch 2027 gift designs by early October, since spending now starts well before Black Friday.
5 Pain Points to Fix Before 2027
1. “My margins disappear after ads and shipping”
Average seller margins sit near 20%, and platform fees can take a quarter of revenue. Plain apparel faces the heaviest price pressure. Duties on small imports will add more cost pressure in 2027.
- Raise perceived value with names, dates, or photos instead of cutting price.
- Build shipping into the price on light items, then show “free shipping” clearly.
- Bundle related items, like a mug and a tee, to lift order value.
2. “Shoppers add to cart, then leave”
Nearly seven in ten carts are abandoned, and extra costs are the top fixable reason. Slow delivery pushes another 21% away. Shoppers judge you on the date the item arrives, not the production step.
- Show a delivery date and shipping cost on every product page.
- Produce close to your main buyers, especially for US orders.
- Offer faster shipping for gifts in November and December.
3. “Returns and reprints eat my profit”
Online apparel returns run near 24%, and custom items rarely resell. A misspelled name means a full reprint. Every avoidable return comes straight out of your margin.
- Add size charts with garment measurements in inches.
- Show a live preview so buyers approve the exact text before paying.
- Order samples of your top sellers to check color and fit.
4. “My designs look like everyone else’s”
More than 228,000 stores sell POD products, so generic designs blend in. Personalization fixes this because no two orders look the same. AI shopping agents in 2027 will also favor listings with clear, detailed product data.
- Start with three personalized products in your best-selling niche.
- Keep the form short: one name, one date or photo, one style choice.
- Write titles and descriptions that state material, size, and occasion.
5. “I can’t get my first steady sales”
The average POD seller needs 165 days to reach $1,000. Faster sellers publish more listings and stay in one niche. Many stores quit too early, which explains the 24% three-year survival rate.
- Commit to 60 to 70 listings in one niche before changing direction.
- Publish about ten new listings each week on a fixed schedule.
- Add one home décor or wall art product, the fastest-growing segment.
Where Shopify POD Apps Fit in Your 2027 Workflow
Apps do not fix a weak niche, but they remove friction at each step. A future-ready POD workflow has three layers:
- Fulfillment: prints, packs, and ships each order close to your buyers.
- Personalization: lets shoppers add names or photos with a live preview.
- Connection: sends personalized, print-ready files to production automatically.
Printful: Print on Demand
Printful: Print on Demand by Printful Latvia AS connects your store to print, embroidery, and all-over-print production. It covers apparel, wall art, blankets, drinkware, and home décor. Orders sync automatically and ship under your brand.
It fits stores that care about branding and unboxing. Custom packaging, pack-ins, and inside labels help a small store feel established. Production locations include the US, Mexico, Canada, and Europe.
Printify: Print on Demand
Printify: Print on Demand by Printify connects your store to a global network of print providers. You can add designs to more than 1,300 products. It also syncs with Etsy, Amazon, eBay, TikTok, Wix, and Squarespace.
It fits sellers who want to compare providers on price, quality, and shipping time. Picking a provider near your buyers helps with margin and delivery speed. The free plan supports five stores and unlimited designs.
Gelato: Print on Demand
Gelato: Print on Demand by Gelato produces orders through 140+ local hubs in 32 countries. Local production shortens delivery for buyers in the US, UK, EU, and Australia. The catalog includes apparel, wall art, calendars, and drinkware.
It fits stores selling across several Tier 1 countries. It helps with slow delivery and with duty costs on cross-border orders. Design tools and personalization features are built in.
Customily Product Personalizer
Customily Product Personalizer by Customily adds a live-preview customizer to your product pages. Shoppers can add text, photos, star maps, calendars, and AI image filters. The app exports print-ready files automatically.
It is the personalization layer that sits on top of your fulfillment app. It connects with Printify, Printful, Gelato, ShineOn, CustomCat, Gooten, and more. That cuts manual file work and spelling errors before production.
ShineOn: Print On Demand
ShineOn: Print On Demand by ShineOn focuses on personalized jewelry, message card gifts, and engraved watches. The catalog also includes apparel, blankets, and wall art. Orders sync to Shopify for US production and tracking.
It fits gift-focused stores selling to US buyers around holidays. Paid plans add per-unit savings, expedited shipping, and upsells. It works with Customily, TeeInBlue, and HelloCustom.
Comparison of Shopify POD Apps by Workflow Role
This table combines Shopify App Store details with 2026 install data from Store Leads and StoreCensus.
| App (developer) | Workflow role | Shopify stores using it | US share of stores | Top store category | Paid plan | What the paid plan adds |
| Printful: Print on Demand (Printful Latvia AS) | Branded fulfillment | 145,754 | 69.3% | Apparel (44.4%) | $24.99/mo, free after $12K yearly sales | Up to 33% off products |
| Printify: Print on Demand (Printify) | Print provider network | 92,977 | 77.3% | Apparel (45.2%) | $39/mo | Up to 33% off, 10 stores |
| Gelato: Print on Demand (Gelato) | Local production, 32 countries | 27,151 | 41.1% | Apparel (36.5%) | $29.99/mo | Up to 33% off, mockup tools |
| Customily Product Personalizer (Customily) | Live-preview personalization | 2,536 | 53.4% | Apparel (23.8%) | $49/mo + 0.10–1 per item | Unlimited print-ready exports |
| ShineOn: Print On Demand (ShineOn) | Personalized jewelry and gifts | 7,747 | US-based production | Gifts (22.1%) | From $27/mo | 1–4 off per unit |
Disclaimer
The statistics in this article come from publicly available online sources, including market research summaries, company filings, app store listings, and third-party data platforms. Figures marked as 2027 projections are our own estimates, calculated from each source’s published growth rate, and are not guarantees. Reports use different definitions and methods, so their numbers can disagree. App ratings, install counts, and prices change often. Please recheck every figure at its source before using it in business decisions or published content.
Conclusion
The print-on-demand market keeps growing at roughly 20% to 26% a year and should approach $19 billion in 2027 on leading estimates. North America remains the largest region, while home décor, DTF printing, and owned webstores grow fastest. Personalization stays the clearest way to protect margin, because shoppers pay more for items made for them.
The 2027 risks sit inside each order. Surprise shipping costs drive abandoned carts, permanent US duty rules raise import costs, and apparel returns erase profit. AI shopping agents will also reward stores with clean, detailed product data.
The plan is simple. Price personalized products above plain ones, show delivery dates early, and produce close to your buyers. Prepare product data for AI shopping, publish steadily in one niche, and review results every 30 days.
FAQs About Print-on-Demand Statistics 2027
How big will the print-on-demand market be in 2027?
Based on published growth rates, the global POD market should reach about $11.7 billion to $20.5 billion in 2027. Mordor Intelligence’s 25.05% CAGR points to about $19 billion.
Is print-on-demand still worth starting in 2027?
Yes, if you plan for margin from day one. The market grows about 20% to 26% a year, but Mordor Intelligence reports only a 24% three-year store survival rate.
What is a good profit margin for a POD store?
Most POD sellers target margins between 20% and 40%, per Printful. Personalized products can pass 50%, while basic items may fall near 10%.
Do personalized products really sell for more?
Yes. Shoppers say they will pay about 25.3% more for personalization, per Dassault Systèmes. A live preview and clear delivery date turn that interest into orders.
How will AI shopping agents affect POD stores in 2027?
More than 90% of ecommerce leaders expect AI agents to influence at least 20% of orders by 2027, per Chain Store Age. Stores with clear titles, sizes, materials, and delivery times will be easier for agents to recommend.
Which POD products will grow fastest in 2027?
Home décor is the fastest-growing product type, at 26.74% CAGR, per Mordor Intelligence. Personalized gifts and wall art are strong additions to apparel stores.

Digital Marketing Head
Vijay Chavda is the Digital Marketing Head at SetuBridge Technolabs with 14 years of expertise in driving growth strategies. Beyond marketing, he is skilled in data analysis, leveraging Power BI and Tableau to turn insights into action, blending creativity with analytics for impactful business results.