





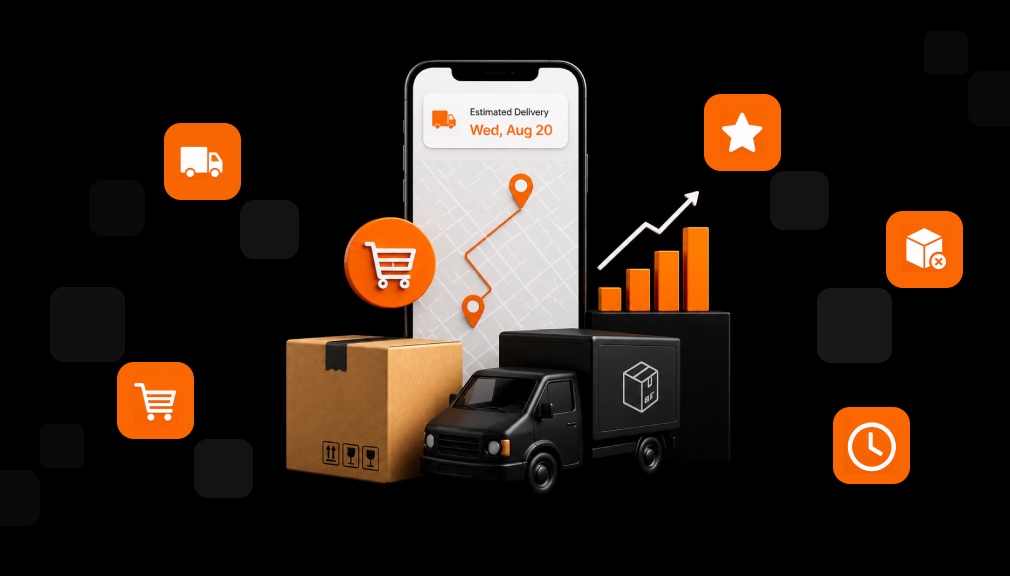
Delivery has turned out to be one of the most critical components in determining whether a consumer will make a purchase, return, or defect to a competitor. The delivery speed, free delivery options, and even the delivery date have started dictating decisions at all stages. Here, we present an analysis of more than 60 ecommerce shipping and delivery statistics for 2026.
Every statistic here is sourced and categorized according to theme. There is one consistent theme throughout.
What’s inside
- The shipping and delivery market in 2026
- What shoppers expect from delivery speed and timing
- Delivery dates and conversion
- Shipping costs and free shipping
- Cart abandonment and checkout
- The post-purchase experience: tracking, delays, and loyalty
- Where delivery is heading, plus strategies and FAQs
The shipping & delivery market in 2026
Delivery is now a massive, fast-moving industry that touches every online order.
1. Global parcel market: The worldwide parcel-delivery market is set to reach about $538 billion in 2026. (SellersCommerce)
2. Parcel volume: Roughly 236 billion parcels will be delivered worldwide in 2026. (Opensend)
3. Daily packages: That works out to more than 647 million packages moving every single day. (SellersCommerce)
4. US shipments: The US alone is projected to ship about 24.6 billion packages in 2026. (Opensend)
5. Same-day boom: The same-day delivery market is growing at nearly 20.8% a year, toward $17.8 billion in 2026. (Opensend)
6. Cross-border growth: Cross-border B2C ecommerce is expected to hit $2.16 trillion in 2026, up from $1.72 trillion. (Opensend)
7. Faster worldwide: Average international delivery has fallen to 6-8 days on major routes, down from 10+ in 2022. (Opensend)
8. Last-mile cost: The last mile now accounts for about 53% of total shipping costs. (Ringly)
9. Automation surge: Around 4.7 million warehouse robots were running in 50,000+ warehouses in 2026. (SellersCommerce)
What shoppers expect from delivery speed & timing
Patience is shrinking, and fast delivery has shifted from a perk to a default expectation.
10. Two-day standard: About 74% of online shoppers now expect delivery within two days. (Opensend)
11. Shrinking patience: The average shopper will wait just 2.6 days for an order, down from 3.5 a few years ago. (AlixPartners)
12. Same-day option: Roughly 80% of consumers expect same-day delivery to at least be an option. (Opensend)
13. Young shoppers: 56% of shoppers aged 18-34 expect same-day delivery. (Capital One Shopping)
14. Same-day pull: 70% are more likely to shop online when same-day delivery is offered. (Capital One Shopping)
15. Best incentive: 69% say one-day delivery is the single best incentive to buy online. (Capital One Shopping)
16. Two-day switch: 63% will pick a different retailer next time if shipping takes over two days. (Capital One Shopping)
17. Delivery windows: 92% of shoppers weigh delivery windows when deciding to buy. (Capital One Shopping)
18. Speed matters: 62% consider shipping speed critical to a good online experience. (Capital One Shopping)
19. Paying for speed: 71% would pay an extra $3 for next-day delivery. (Capital One Shopping)
20. Reliability over speed: McKinsey found on-time reliability now outranks raw speed, which fell from first to fifth priority. (ClickPost)
Delivery dates & conversion
This is where the estimated delivery date earns its keep: a clear, accurate date lifts sales.
21. The conversion lift: A specific delivery date can raise conversion by 13- 25% versus a vague shipping range. (Digital Applied)
22. Date visibility: More than 75% of shoppers say a visible delivery date positively influences their decision to buy. (eShipz)
23. Accuracy beats speed: 62% say an accurate estimated delivery date matters more to them than fast shipping. (Capital One Shopping)
24. Real case, product page: One brand lifted product-page conversion 19% and checkout conversion 10% with accurate dates. (Narvar)
25. Real case, checkout: Harry Rosen saw a 13% checkout conversion lift after switching to AI-powered delivery dates. (Narvar)
26. Real case, profit: Maude reported a 12% conversion lift and a 10% profit lift from a product-page delivery ETA. (Digital Applied)
27. Checkout expectation: Over 85% of shoppers expect to see an estimated delivery date at checkout. (WeSupply Labs)
28. Fewer abandons: Showing delivery dates has been linked to a 36% drop in cart abandonment. (WeSupply Labs)
29. Where it counts: Delivery dates convert best at three moments: the product page, checkout, and tracking. (ClickPost)
30. Accuracy target: Leading delivery-date tools hold 95%+ date accuracy to keep the promise credible. (Narvar)
Shipping costs & free shipping
Free shipping remains one of the strongest levers in ecommerce, often beating speed.
31. Free over fast: 82% of shoppers say free shipping matters more to them than fast shipping. (Capital One Shopping)
32. Clear preference: 88% choose free shipping over fast shipping when asked to pick. (Ringly)
33. The threshold effect: 80% expect free shipping above a set order value, and 66% expect it on every order. (SellersCommerce)
34. Purchase driver: 92% say free-shipping offers influence their purchase decisions, up from 83% in 2023. (SellersCommerce)
35. Deal-breaker: 62% will not finish a purchase if shipping turns out not to be free. (Capital One Shopping)
36. Conversion boost: Offering free shipping lifts conversion rates by about 22%. (Capital One Shopping)
37. Bigger baskets: Free shipping raises average order value by 15-20%. (Capital One Shopping)
38. Willing to wait: 76% of shoppers will wait longer if it means avoiding delivery fees. (Sendcloud)
39. Free beats express: 95% prefer free standard shipping over paid express delivery. (Capital One Shopping)
40. Patience for free: Over 80% will still buy with a 4-7 day wait if shipping is free. (Capital One Shopping)
41. Cart-building: 93% of shoppers change what they buy to qualify for free shipping. (Capital One Shopping)
Cart abandonment & checkout
Delivery problems are one of the top reasons shoppers leave a full cart behind.
42. The baseline: About 70% of online carts are abandoned before checkout. (ClickPost)
43. Delivery-driven exits: 48% of shoppers abandoned a cart in the last three months over delivery issues. (Sendcloud)
44. Cost shock: 48% of US shoppers name extra costs like shipping as the top abandonment reason. (ClickPost)
45. Slow loses sales: 43% have abandoned a cart or a store because shipping was too slow. (Capital One Shopping)
46. Shipping fees: 30% have abandoned an order specifically because of shipping costs. (Capital One Shopping)
47. Poor options: Two-thirds of shoppers have abandoned a cart due to unsatisfactory shipping choices. (Alexander Jarvis)
48. Uncertainty barriers: Unexpected costs (19%), longer-than-expected delivery (17%), and surprise customs (16%) hold shoppers back. (Sendcloud)
The post-purchase experience: tracking, delays & loyalty
Delivery does not end at checkout: the arrival experience decides whether shoppers return.
49. Tracking is essential: 88% say real-time delivery tracking is critical to a positive experience. (Capital One Shopping)
50. The WISMO tax: “Where is my order?” queries make up 30-40% of support volume, at $5-22 each. (Ringly)
51. One strike, out: 60% of consumers will not shop again after a single late delivery. (SmartRoutes)
52. Poor experience, lost customer: 85% say a bad delivery experience would stop them from reordering from that retailer. (Karla)
53. Loyalty upside: On-time delivery can lift customer loyalty by up to 25%. (SmartRoutes)
54. Repeat driver: 76% say a positive delivery experience influenced their decision to buy again. (Bizrate Insights)
55. Word of mouth: 94% of satisfied customers recommend the retailer to others. (SmartRoutes)
56. Power-shopper churn: 68% of power shoppers have quit a brand after a delivery failure, versus 42% of regular shoppers. (Bringg)
57. Best customers, biggest risk: Frequent shoppers are 2.5x more likely to churn after a poor delivery. (Karla)
58. Timing and returns: Every day a delivery is late lifts returns by about 1.1%, and every day early by about 1.2%. (Capital One Shopping)
59. Returns reality: Roughly 30% of online orders are returned. (SmartRoutes)
60. Communication saves: 43% are more likely to stay satisfied when kept informed about delays. (Alexander Jarvis)
Where delivery is heading
In every study, the trend has been consistent. Reliability and flexibility are overtaking speed as well as free shipping to become the true factors of loyalty. Customers who have experienced reliable same-day deliveries from one brand will take it into account when shopping at other stores.
Moreover, providing an exact delivery date has become something more than just an addition to the product page. In 2026, the winners are the companies that promise a delivery and deliver on time.
How Shopify merchants can turn these numbers into sales
The data points to a handful of clear, practical moves for any store.
- Show a clear delivery date on the product page. Answer “when will it arrive?” before the shopper reaches checkout.
- Repeat the date across the journey. Keep it consistent on the cart, checkout, confirmation, and tracking page.
- Set realistic cutoffs and lead times. Use per-product and per-location rules so the date is one you can meet.
- Keep the promise. Accuracy protects loyalty and cuts costly “where is my order?” tickets.
- Communicate proactively. Send updates after the order, especially if the delivery date changes.
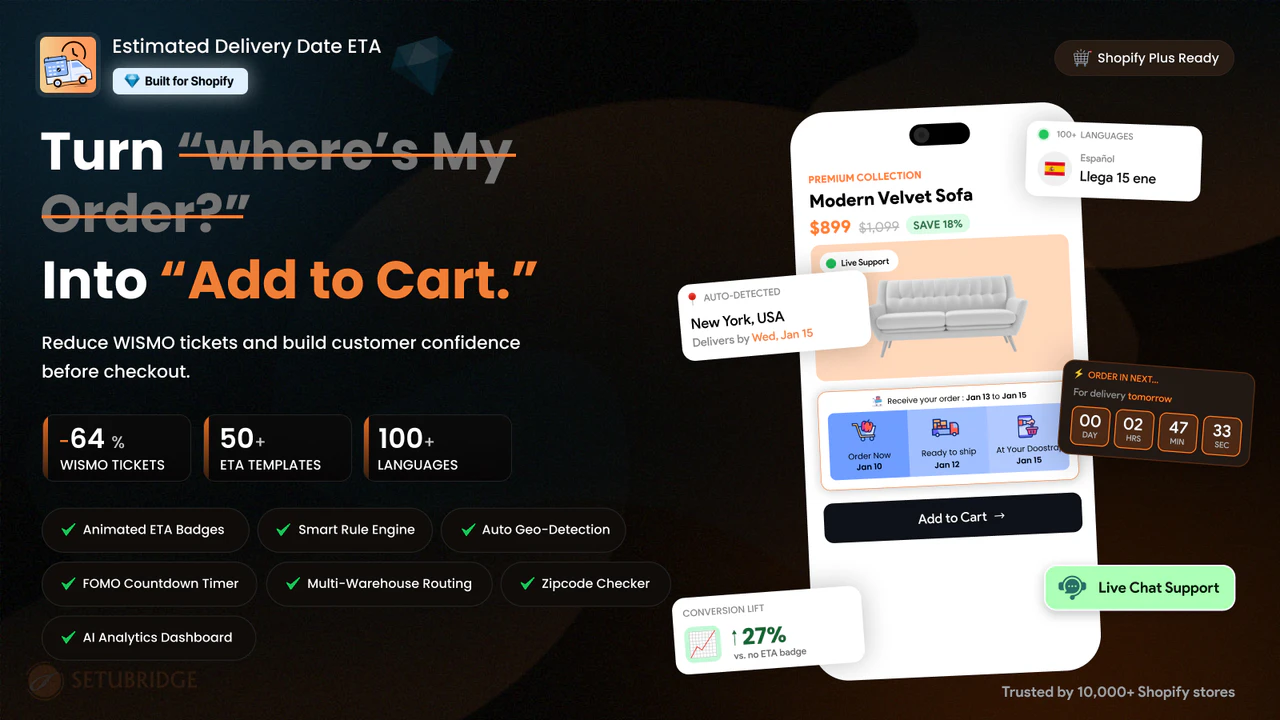
A dedicated Shopify app makes this simple. Estimated Delivery Date ‑ ETA shows accurate estimated delivery dates on your product pages, cart, and checkout, with smart rules for cutoffs, products, and locations.
Frequently Asked Questions
Why do delivery dates matter for ecommerce conversion?
Delivery dates answer the shopper’s biggest pre-purchase question: when will it arrive? A clear, specific date removes hesitation at the exact moment of buying. Research shows specific dates can raise conversion 13-25% over vague ranges, and more than 75% of shoppers say a visible date influences their decision. In short, certainty converts better than a fuzzy “ships in a few days.”
How fast do customers expect delivery in 2026?
Expectations keep tightening each year. About 74% of shoppers expect delivery within two days, and the average shopper will wait just 2.6 days. Around 80% now expect same-day delivery to at least be an option. That said, many will happily wait longer if shipping is free, so speed and cost must be balanced.
Does showing an estimated delivery date reduce cart abandonment?
Yes, because delivery uncertainty is a leading cause of abandonment. Nearly half of shoppers have left a cart in the last three months over delivery issues. Showing a clear date early answers that doubt before it grows, and it has been linked to sizable drops in cart abandonment. It works best when the date is accurate and shown on the product page.
What is a good estimated delivery date accuracy?
Aim as close to 100% as your fulfilment allows, since accuracy is what builds trust. Leading delivery-date tools hold accuracy above 95%. An inaccurate date is worse than none, because a missed promise drives returns, refunds, and support tickets. Track your on-time rate and adjust cutoffs and lead times to keep it high.
Where should I display the estimated delivery date on my store?
Show it at every high-intent moment for the best effect. The product page is the most important spot, since that is where the buying decision happens. Repeat it in the cart, at checkout, in the confirmation email, and on the tracking page. Consistency across these touchpoints keeps the promise clear from click to doorstep.
The bottom line
All of the data indicates a single pattern. Customers today measure a business’s reliability by its delivery time in addition to cost and product. The certainty and accuracy of delivery time increase conversion, reduce cart abandonment, and create customer trust that makes them come back again. An estimate of delivery time for Shopify stores is one of the easiest ways to enhance your sales.
The data reflects the latest figures up until 2026; the source material is regularly updated, so make sure to check the latest statistics before referencing them formally.

Digital Marketing Head
Vijay Chavda is the Digital Marketing Head at SetuBridge Technolabs with 14 years of expertise in driving growth strategies. Beyond marketing, he is skilled in data analysis, leveraging Power BI and Tableau to turn insights into action, blending creativity with analytics for impactful business results.